GDS systems include a simple chart generator capable of drawing simple charts, such as line, pie and bar charts, timelines and progress bars. This generator allows a specially structured URL to return a fixed chart. This allows reports to easily embed charts and graphs. The chart generator is designed primarily to generate small thumbnail type charts.
The URL is constructed with the following format. (Skip to Examples )
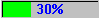
/geni/charttype_Arguments.ImageFormat The Url /geni/progress_p30.png generates a simple 30% progress bar with several defaults, To insert the image into a web page, this constant known URL can be placed in the page using an IMG tag, such as
<IMG SRC="/geni/progress_p30.png" width=100 height=18>
Javascript can also be used to dynamically insert a chart:
<span id="thechart"></span> (Define where the chart appears) Simple generated charts are designed to be cached by browsers and intermediate Web Caches in order to reduce the
generating load on the main server and improve end user response.
The chart generator takes into account the user language set by the browser when creating charts, so automatically
supplied labels such as months of the year and inserted in the users preferred language. If the language is unknown, english
will typically be used as a fallback language.
 The "p30" is defining the percentage argument to be 30. Arguments are commonly named across chart types, and arguments that are not used by a given
chart type are simply ignored.
The "p30" is defining the percentage argument to be 30. Arguments are commonly named across chart types, and arguments that are not used by a given
chart type are simply ignored.
<script>
var Pct = 44; // Set to desired percentage
document.getElementById("thechart").innerHTML = '<img src="/geni/progress_p'+Pct+'.png">';
</script>
Chart Types
The chart type keyword can take any of the following values. There is both classic charts and graphic object types.
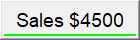
Progress
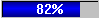
A simple progress bar showing a percentage amount.
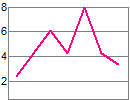
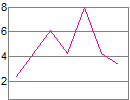
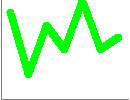
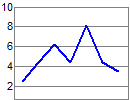
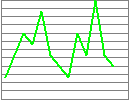
Line
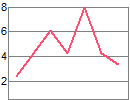
Simple line charts showing absolute values
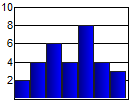
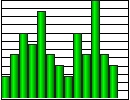
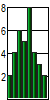
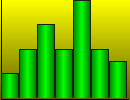
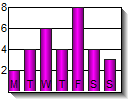
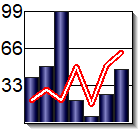
Bar
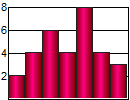
Simple bar charts showing absolute values
Temp
A stylised temperature guage showing a percentage amount.
Arrow
![]()
![]()
A up or down arrow showing percentages against a reference.
Dial
In Dev. A guage type display showing a single value against a maximum.
Slevel


In Dev. A variant of a progress bar that can show the positive and negative amounts from a center line.
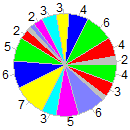
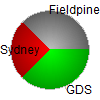
Pie
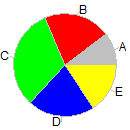
A pie chart showing multiple values as percentages of the sum
Timeline
A timeline display placing marks on a line representing time.
Scatter2p
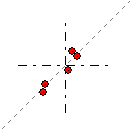
In Dev. A scatter chart showing the relationship between two variables
clipart
In Dev. Insert public domain clipart images.
photoart
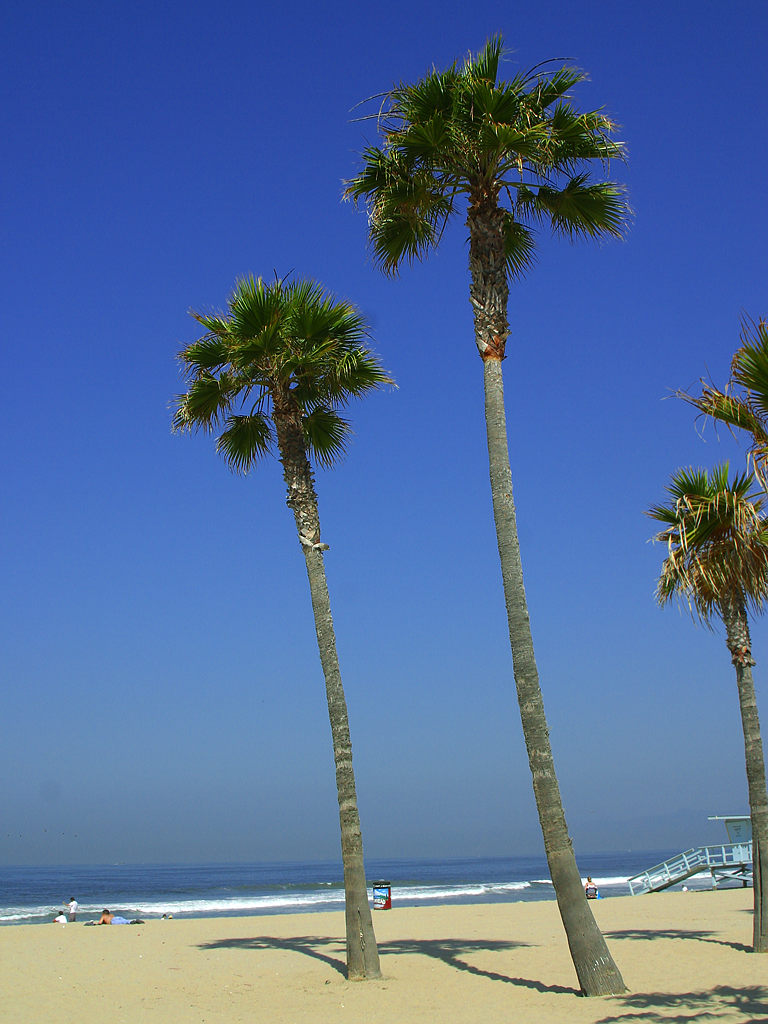
In Dev. Insert public domain or Creative Commons licensed imagery. Do not assume that images provided here are safe to be extracted and used freely
lib

In Dev. Insert a standard image for an object. Commonly used to obtain an image given a barcode or product id.
vis
In Dev. Draw a relationship chart
button

In Dev. Draw a button with simple graphical attributes
stockart

Special use only. Insert stockart, which is NOT public domain imagery and may have usage restrictions.
Barcode
In Dev. Insert a generated barcode graphic
_rt specifies symbology
Boxplot
Insert a boxplot, which allows easy statistical comparison
Tag Cloud
Insert a tag cloud, which shows relative weights of tags. The chart generator returns HTML for this request, not an image, meaning it should be hosted in an IFRAME or similar.
Flag

Insert flags from countries of the world. Country numbers use the standard GDS country codes, which broadly match the international dialling prefixes.
Chip
Draw standardised GdsMachines chip outlines.
GdsItem

Inserts graphic for an item which has a GdsItem standard category or product code. Not yet available for general use.
QRcode
Insert QR codes
ColorBar
A multi colored bar where the size of each color depends on the weight of a point
Audio
Generate spoken text audio clip. Not all browsers are capable of dynamic audio control.
Chart Arguments
Charts are controlled using a series of arguments specified in the URL. Each argument starts with 1 or more letters defining the argument and then the value. Most arguments do not use a delimiter between the argument name and the value. For example, to set the width to 200, you specify "x200" not "x=200".
Not all arguments apply to all chart types. The generator does not guarantee that a given request will always generate exactly the same appearance. Over time as formats are improved minor differences may occur, but they will not alter the major intent of what is requested. This means that the background images or line styles may change slightly over time, but a bar chart will always be a bar chart.
| Code | Description |
| Ab | Bounding box. Takes two numbers as arguments and resizes the image to fit within this bounding box. Images scaled to fit inside a bounding box maintain aspect ratios. Applies to gdsitem and lib chart types only. Example. /geni/lib_ab200,200fd101=202fd100=11005 Display product pid 11005, in a maximum 200x200 area. |
| Az | Z Angle of the viewport. |
| As | Width of shadow around plot area. |
| Cb | background |
| Cf | The face or fill colour. This is the primary main colour that would be expected. The colour value is expressed as a hex triple. Eg: cf00ff00 Sets the face colour to Green or RGB(0,255,0) |
| Cp | Clip Art id |
| Cr | Border |
| Ct | Color threshold. Sets a level above which the color will change to a different color band. This code takes a numeric (integer) threshold value. Alternatively, the single letter 's' can be used to specify a smear color change |
| Fn | Font face name. Names are terminated with a dot character. |
| Fs | Font face size |
| Gs | Colour gradient. When filling colour areas a gradient can be applied to smear the colour. The gs value specifies the amount of colour to reduce the colour by before smearing. You can specify a value between -255 and 255. The effect of the smear depends on the colour being used. Gs can also take a second value, separated by a comma. This indicates a second smear amount, such that the smear action will first smear up (or down) by the first number towards the middle of the filling region, and then smear down (or up) by the second amount. Chart types will select a default smear direction, horizontal or vertical. You can override this selection by forcing a horizontal smear using 'gsh', or using 'gsv' for a vertical smear. |
| Lg | Line Gap. Defines the gap to appear between different plot values where possible. On a bar chart this sets the gap to insert between each value plotted. |
| Lw | Line width. Sets the width of the pen for drawing, in pixels. The default is 2. |
| M | Max |
| My | Sets the maximum value to be plotted on the y axis. If this is not specified, the value is calculated from the input values. |
| P | Percentage. Provides a shortcut technique for specifying a percent value. |
| Plim= | Used by CommsAgent to set a row limit, typically on SQL= parameters. |
| Sql= | Specifies a SQL query used to load values. This is implemented by CommsAgent and use is discouraged as this may cause intermediate HTTP caches to display old information. (The SQL is constant text, causing a cache hit on stored images, even though the data may have changed) |
| Sz= | Sets both x and y sizes. This parameter is implemented by CommsAgent, not the Image DLL |
| Tb | Text RGB |
| Tf | Text RGB |
| tn | Text RGB |
| Tx | Main Text |
| v | Value List |
| x | Sets the width of the bounding rectangle to N pixels. Eg: x400 sets the width to 400 pixels |
| Xa | Reserved for x tick marks. Sets the height of tickmarks above the baseline |
| y | Sets the height of the bounding rectangle to N pixels. Eg: y200 sets the height to 200 pixels |
| ya | Sets the number of legend bars to draw on the Y axis. |
Color Thresholds
Color Thresholds provide a way of defining bands of color that are used according to the value selected. Currently color thresholds are only available for progress charts.A chart implements the "cf" parameter to set the background color, however, if you want the chart to change color in response to the values being plotted, you can define a number (maximum 30) of bands of different colors. This banding allows simple scripts such as HTML pages to select various colors where selecting the color at runtime may be difficult.
Example 1:
Defining a red progress bar that changes to green for values greater than 50%
/geni/progress_ cf ff0000 ct 50 cf 00ff00
(Remove spaces for actual use) This defines the base color to red (ff0000), sets a threshold at 50 (ct 50) and then defines the green color (cf 00ff00)A color smear causes the system to automatically calculate the appropriate color based on the value and two color extremes. This is most easily explained with an example.
/geni/progress_p?? cf ff0000 cts cf 00ff00 ( p10%  p30%
p30%  p60%
p60%  p90%
p90%  )
)
(Remove spaces for actual use, p?? should reflect the actual percentage)
- Specifies the left (0) color is red (cf ff0000)
- Selects color smear mode (cts)
- Specifies the right (100%) color is green (cf 00ff00)
- Values between 0 and 100 will then take a color between red and green depending on their value. This smear operation is a simple apportionment of the RGB values.
Image Formats
The chart generator is capable of producing JPEG or PNG format output. You can place the extension you want on the end of the URL and this format will be generated. The generator will accept requests without an extension, in which case it will endeavour to select the best output format for the request that the requesting device is capable of.
Generally, you should request photographic type images in JPEG format and charts and cliparts in PNG format.
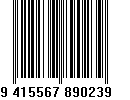
Creating Barcode Images
Barcode images are generated by specifying the barcode contents after the barcode keyword and optional arguments after this. For example, to generate a barcode image containing "1234", the url to specify would be /geni/barcode_1234
The symbology of the barcode can be supplied in the _rt argument, and the following values are available: EAN8, EAN13, EAN128, Code39
Example Gallery
A number of examples are shown, to see the arguments used right click on the image and select 'properties'Progress Bars


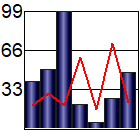
Bar Charts


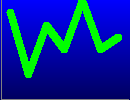
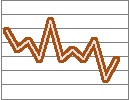
Line Charts


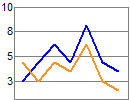
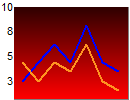
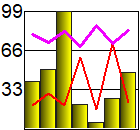
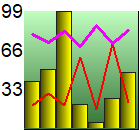
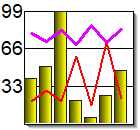
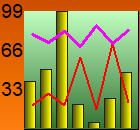
Combinations
Buttons

Pie Charts
Flags


Lib Charts
Lib charts are used to insert a graphical image for a known entity, such as a barcode, product,
customer, staff member and other such concepts. This single call saves you the effort of finding and
displaying images given a reference key.
/geni/lib_args
Examples:
- /geni/lib_rtstaff_rk14 In insert a picture of staff member tid=14
- /geni/lib_rtstaff_rk14_rf1 In insert a picture of staff member tid=14, if none found then .....
- /geni/lib_rtlocation_rk2 In insert a picture of location (store) number 2
Lib Charts
Lib charts are used to insert a graphical image for a known entity, such as a barcode, product,
customer, staff member and other such concepts. This single call saves you the effort of finding and
displaying images given a reference key.
/geni/lib_args Examples:
- /geni/lib_rtstaff_rk14 In insert a picture of staff member tid=14
- /geni/lib_rtstaff_rk14_rf1 In insert a picture of staff member tid=14, if none found then .....
- /geni/lib_rtlocation_rk2 In insert a picture of location (store) number 2