
The pareto report is often overlooked, and often those how do look at it don't always understand what it is trying to tell them - it looks like a lot of pretty colours, numbers and letters, but what does it mean?
Opening the Report
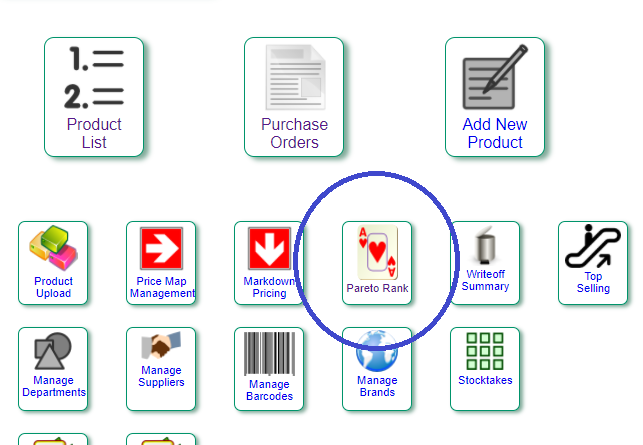
From your main menu, click on Products. Find the option named Pareto Rank with the Ace of Hearts icon, and click on it to open the report
The Report
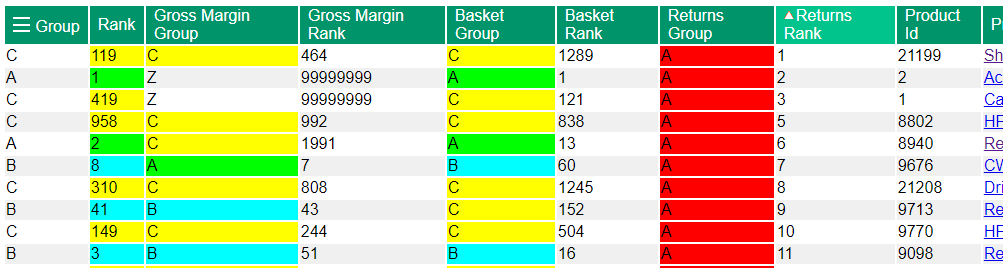
When the report opens and finishes calculating you will see something similar to below.
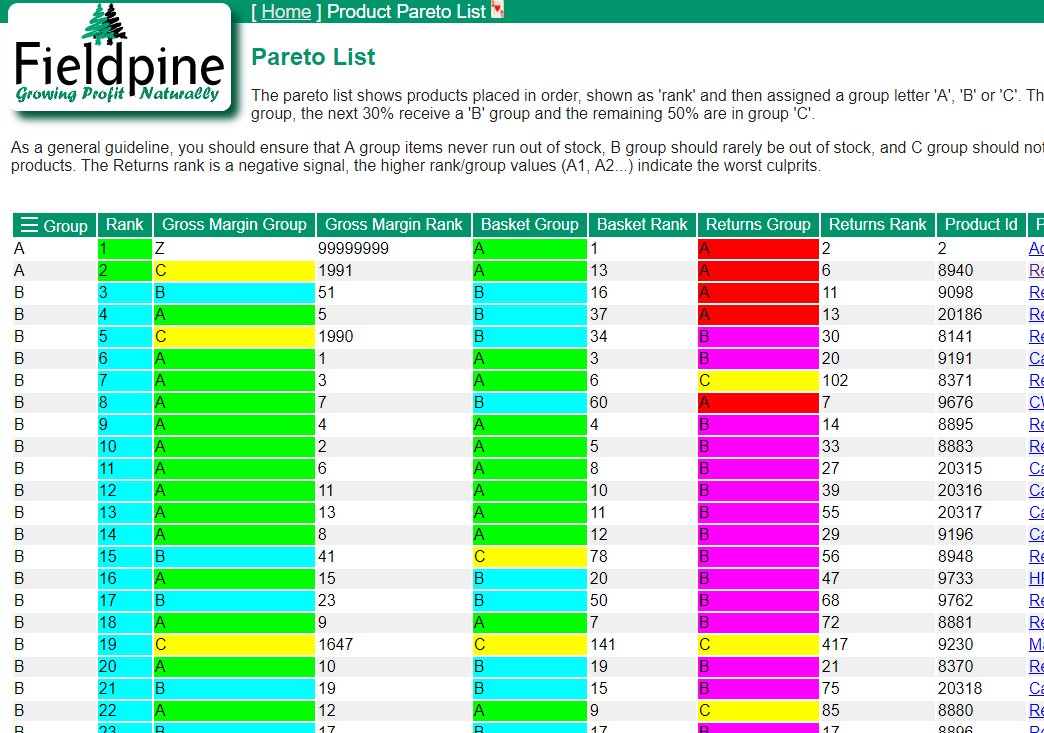
While each line represents a single product, the columns are actually in 4 groups for each product. The first two columns "group" and "rank" are related, as are the next two "Gross margin group" and "gross margin rank", and so on.
So what are these rank and group values exactly? Imagine if you sorted all your products into order from highest revenue to lowest revenue. The first item, with the highest revenue, is given rank #1, the next item is rank #2 and so on down the list. What the pareto principle says is that the top 20% of your ranked products will likely be responsible for 80% of your revenue. This is often referred to as the 80/20 rule.
Once products are ranked, this report then assigns them to a pareto "group", all the products that make up the first 20% of your revenue are assigned "A". The next 30% are assigned "B", and remainder are placed in "C" group. So the more revenue a product produces for you, the higher its rank, and thereby the better the group it receives.
On this report, this ranking is repeated 4 times:
- On raw turnover, in columns "Rank" and "Group"
- By total gross profit on each item, in columns "Gross Margin Rank" and "Gross Margin Rank". The individual gross profits for each sale line are calculated, summed for each product and then ranked
- By Basket. This is slightly different, products are ranked by how frequently they are included in each basket (A basket in retail terms is the collection of items that are included in a single sale - ie what the customer has in their shopping basket)
- By returns. Items are ranked by total revenue refunded to customers.
Side note, in the report above you will see a group of "Z". The report allocates products to Z group when they have no ranking signal. In the example above, the first product has no cost price, so we cannot calculate gross margin, so the report assigns it a "Z"
What the pareto principle suggests is that all you effort should be focused on A and possibly B group items. "C" group items are the general filler in your store that are not star items. Now this principle doesn't hold completely in all retail environments, so always verify results before writing off the "C" items. As the pareto report is reporting based on revenue, important low value items might get missed.
What good is this?
Lets look at a couple of the areas
Sort the report by "rank". The products that are assigned "A" and "B" are where the bulk of your revenue is coming from. You should ensure you alway have stock of these item, as running out of stock is likely to impact your cash flow.
If we look at this slightly more carefully, we see that our second highest ranked product (reminder, this 2nd most revenue earner), has a gross margin rank of 1991 from the "C" group. So this item that is good for cash flow is uninteresting from a profit perspective. This suggests you might want to investigate pricing and margins, so get a better deal from the supplier.
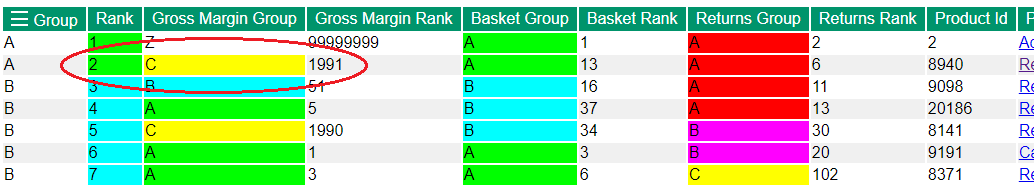
This is why the report has so many colours, as starting at the top you want to see "all green", changing to "all teal" and finally yellow at the bottom. Where you suddenly see a "yellow" out of place, it serves as a quick visual signal to investigate.
We can also see that the top revenue products are our highest returns. This is fairly typical.
Now sort by "Basket Rank". We immediately see that our 2nd most common item has a lowish gross margin rank. To be fair, ranking 89 is not bad, but potentially a small widening of margins on this item might be benefical. This item also has a lower than normal return rate, especially in comparison to it's normal revenue rank of "54" (column 2), so when purchased it stays purchased.
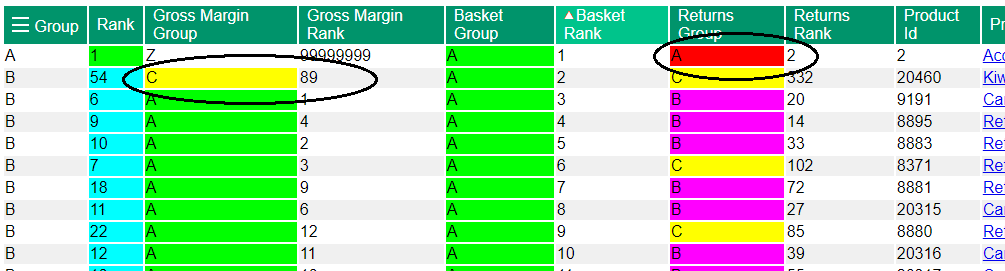
We also see that our most commonly sold item ranks second for returns. You might want to investigate actual return volumes for this item and ensure that all this high basket frequency isn't translating to high returns.
Sort by "Return Rank". This is slightly harder to draw immediate conclusions from as something has to take top spots for returns. But looking at the example shown, we see that our second highest returns comes from our best revenue earner and also most popular product. If actual return volumes are high then addressing this might help in profit and customer satisfaction.
Also of potential interest is that we are getting high returns of products that aren't high revenue, margin or basket ranked items. Our 5th highest return item is group "C" in all other categories. Again, if return volumes are high investigate why. With low revenue and profit, perhaps even dropping this product line might be best.
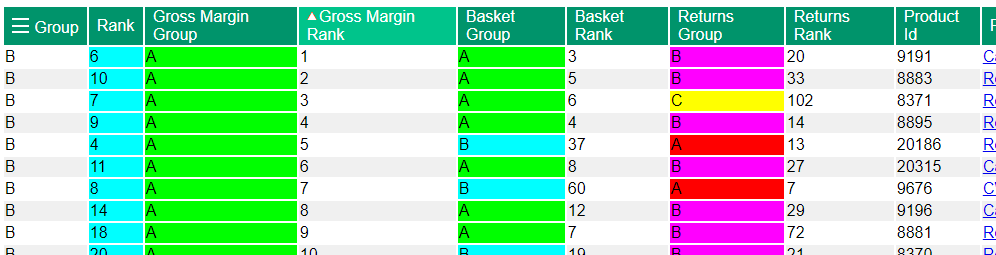
Finally, sort by "Gross Margin Rank". In the example shown below, we aren't too bad on this metric. Our top margin items are mostly "B" group for revenue. They are also reasonably common in customer baskets. This is actually pretty normal for all retailers, we tend to make the most margin on items that are commonly sold unless pricing is radically misconfigured.
All of the pareto report values are designed to show you information you might not immediately know. You should be able to explain and justify why things are the way they are, but you do need to apply in store knowledge to this report. Bad statistics are not necessarily wrong.